This article provides the use of Level of Details in Tableau i.e., LOD.
LOD
expressions are the best and powerful way to get the solution to your business
questions supporting granularity in your Tableau visuals or dashboards.
Level of
Detail is one of the best features of analyzing data in Tableau.
This concept
is not too difficult to understand. Once you wrapped this concept of level of
detail, then you will be very much fluent in tableau functionality as well as
it will be easier for you to design different visuals by using Level of
Details.
The very
first thing one should understand that every visualization has a level of
detail. It may be at the most granular level or least granular level where analysis is done.
So, Tableau Level of Detail expressions (LODs) allow you to change the granularity of the data. This concept is introduced in Tableau 9.0. Prior Tableau 9.0, tableau don't have any idea or workaround to design the different visuals in the dashboard with different levels of detail, But now by using this concept one can design an interactive dashboard, where different visuals have a different level of detail or the granularity of specific measure, can be altered using this LOD concept in Tableau.
What is LOD?
LOD in
tableau is used to check the granularity of data and allows you to compute the
values at the data level or visualization level.
That means,
LOD expressions give you even more control over the level of granularity you want
to compute. Whether you want it can be at a more granular level or less granular
level of detail.
For example,
if you dragged and dropped SUM(Sales)
into Columns shelf and [Profit
Ratio] into the Rows shelf, then you can see below view:
Now in above
tableau worksheet I have not added any dimension to slice and dice the measures
added [Profit ratio] and
[Sales]. If I add one
dimension [Customer Name] into the Detail marks card, then I can see the view
is now changed to see the sales and profit ratio at the customer level of detail.
See the worksheet looks like below:
Here I have
changed the granularity of data from an entire sheet to the customer level.
So, I can
say that by using details shelf of marks card, I can analyze the data at more
granular level without changing the view structure if needed.
Another
example to get a detailed level of an idea about LOD in Tableau:
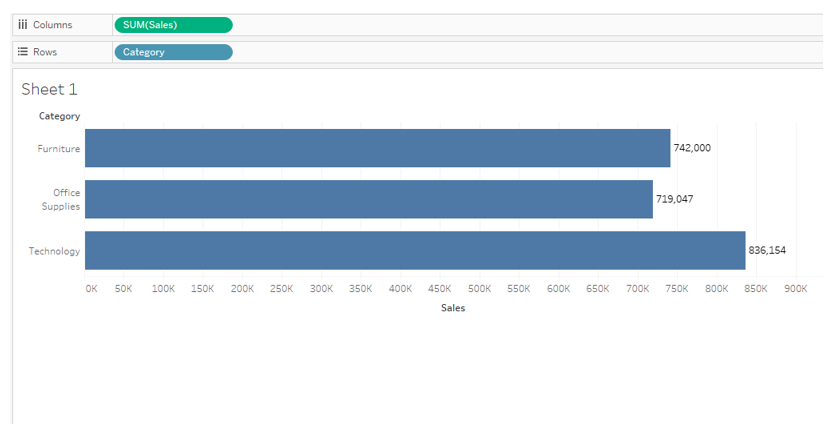
Drag and
drop [Sales] into the
columns and [Category] into rows shelf. Now you can see the view shows Sales
per category, and it is showing sales per category as like below:
Now I want
the sales values to be distributed along with different sub-categories of the given
categories. So, I will drag [Sub-category] into rows next to the [Category].
Now the view will be changed to a more granular level of detail. i.e.
sub-category level.
As you see, earlier there are only three marks to get an analysis of sales done at the category level. But now I have sliced and diced the data to get the sales analysis at the category as well as subcategory level i.e. more granular level.
But what
I want these both analyses separate in the same graph?
I want sales
per category in one column and sales per sub-category in the second column and I
want how much each subcategory is contributing to its parent category.
Now at this point Tableau Level of Details (LOD) comes into the picture.
What is the syntax of LOD expression?
Thumb Rules
to write LOD expression:
2. After opening curly brace ‘{’, write the scoping keywords like FIXED, INCLUDE, EXCLUDE, etc.
3. Then write zero, one or more dimensions which you want to be Fixed, Included, or Excluded from the computation.
4. Add colon ‘:’.
5. Followed by Aggregated measure.
6. At last end the expression with closing curly braces ‘}’.
Types of Level of Detail (LOD):
1. FIXED LOD
2. INCLUDE LOD
3. EXCLUDE LOD
FIXED LOD:
As the name
‘FIXED’ itself says that if I want the granularity of data at the exact level
then it is a FIXED level of detail in Tableau.
So, FIXED
LOD will fix the measure at a certain level of detail.
The
following LOD will calculate the sales at the region level whether there are many
dimensions in the view or not. It will only calculate at the region level.
e.g., {FIXED [Region]: SUM(Sales)}
1. Drag the [Region] into Rows shelf
and [State] into Rows
shelf and [Sales] into the Columns shelf. You will see the bar chart created
as below:
2. Create a calculated field named [Regional Sales]. And write a LOD expression as {FIXED[Region]: SUM(Sales)} and then click OK.
3. Now drag
this field [Regional Sales] into the Columns shelf.
4. Here you will see the values which are getting for the LOD expression written.
Now if you
see in the above image the LOD expression is calculating the SUM(Sales) at
Region level only but the normal sales are calculated at the region as well as
state levels.
Hence, FIXED
LOD will calculate the measure at dimension in the expression irrespective of
dimensions in the view.
The
default level of detail is FIXED LOD. If I could not write scoping keywords or specific
LOD (FIXED, INCLUDE, EXCLUDE) then tableau will by default calculates the
expression at a FIXED level of detail.
e.g., {SUM(Sales)} will
calculate the sum of sales for the entire table. This is equivalent to expression {FIXED:
SUM(Sales)}.
INCLUDE LOD:
INCLUDE level of detail expression is used to view our visual at a specific granularity of dimension which I am mentioning in my LOD expression. And that dimension is not present in the view.e.g., {INCLUDE [State]: SUM(Sales)}
2. Now you will see the bar chart of regional sales.
3.Create a new calculated field as [State wise sales] as {INCLUDE [State]: SUM(Sales)} 4. Drag this LOD calculation [State wise sales] into the Columns shelf and change the aggregation to AVG by right-clicking on both [SUM(Sales)] and [State wise sales].
5. Swap the fields to get [Region] in Columns and [AVG(Sales)] and [AVG (State wise sales)] into the Rows shelf.
6. So, here I can see the average of sales is calculated at State level of details, though [State] it is not present in the view.
7. If you see in the below image the first bar graph is showing overall average sales while another bar graph is showing average sales of states.
See the below image to get a clear idea:
EXCLUDE LOD:
The EXCLUDE level of detail is also the same as FIXED and INCLUDE LOD as the name ‘EXCLUDE’ itself says that it excludes the dimension from the view that means it subtracts the dimension from the view level of detail.
e.g., {EXCLUDE [Region]: SUM(Sales)}
1. Drag [Region] and [SUM(Sales)] into the Columns shelf and2. Create the new calculated field as [Exclude region LOD] as
Now drag this field into the color shelf and see that your view is colored based on month but not by Region which I have added in my LOD calculation.
See the below image:
3. Hence, EXCLUDE level of detail expressions are most useful for eliminating the dimension in the view.
Are Level of Detail expressions Dimensions or Measures?
Depending on the measure in
calculation is written or underlying field in the aggregate expression, the FIXED
level of detail expression can result in measures or dimensions. For example,
{MAX(Date)} will be a dimension as [Date] is a dimension field and
{FIXED [Category]: SUM(Sales)} is a measure as SUM(Sales) is returning a
number which will be by default measure.
But, If I need to change the LOD expression from Dimension to measure or vice versa is possible in Tableau, which I have discussed in my last article ‘Dimensions’ vs ‘Measures’.
Always keep in mind that INCLUDE and EXCLUDE Level of Detail expressions are measures.
Shelves in Tableau worksheet that
defines the Level of detail of visualization:
[Columns,
Rows, Pages, Color, Size, Label, Detail, Path, Workspace]
Want to become a LOD Rockstar? Remember below
key points:
2. Always use LOD after the better understanding of the filters and the execution sequence of filters and LOD expression as like EXCLUDE LOD will execute later in the calculation or I can use table calculation if there are many filters used in the view.
3. Some of the databases do not support LOD expressions.
4. Level of Detail expressions does not support the calculations like LOOKUP, INDEX, etc. Also do not support moving totals, running sum, ranking, etc. And if I need these computations in my view then it can be achieved by table calculations.
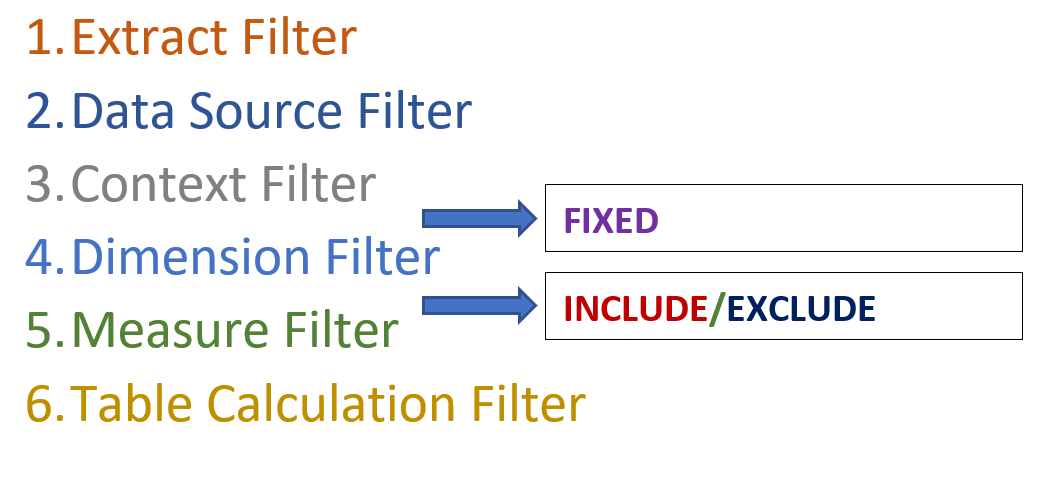
Sequence of execution of Filters and LOD expressions in Tableau:
Top real-time examples where LOD expressions used:
1. Customer purchase frequency/ Order
frequency
2. Cohort analysis
3. Market basket analysis
4. Comparative Sales Analysis
Wrap – Up!
I think you might have gotten a
better idea about What is LOD? or How to use LOD? or when to use it? or some
key points about LOD expressions in Tableau.
I hope you have started loving LODs as they allow you to do some tricky things in Tableau.


