Value of the Exam
The Tableau Desktop Specialist Certification is widely sought after in the Data Analytics world. It evaluates an individual's ability to perform essential analytical tasks. By this Certification exam, Tableau verifies if you are aware of all the functionalities offered by the tool, and able to apply them to good use when needed.Cost and Expiry
The Tableau Desktop Specialist Certification cost is $100. The Validity of the Tableau Desktop Specialist certificate does not expire, unlike some of the other Tableau certificates. To pass the Tableau Desktop Specialist Certification Exam you need to score 70% from 30 multiple-choice questions in 60 minutes. As per 2021 changes, Tableau is moving the exam to Pearson VUE with 45 questions, 40 scored and 5 unscored, and a passing scaled score of 750. The Tableau Desktop Specialist Practice Exam below will give you a comprehensive experience of the main test.Official Exam Guide
The Exam Syllabus can be downloaded from the 'References' section of the Menu above. There is no eligibility criterion to take the Tableau Desktop Specialist Certification Exam. However using Tableau for atleast 12-16 weeks with various hands-on activities is strongly recommended before taking this test. Complete our Tableau Desktop Specialist Practice Exam below for practice questions and knowledge-based quiz. Choose 'Schedule Exam' from the References Menu above to schedule the final exam with Tableau when you are ready.Planning the Actual Exam

BUY @ $6 / MON BUY @ $34 / YEAR LOGIN LIVE HELP @ $37 / MON


✍ Download the Tableau Desktop Specialist Certification Exam Guide from the 'References' section of the Menu above. The below Free Tableau Practice Exam will give you a good vibe of the actual exam. For tougher questions and exclusive content get access to our Tableau Desktop Specialist Certification Premium Exam. It is important to note that your score in the main exam will be very similar to the free practice exam below. So in the below practice exam if you are struggling with some questions and topics, or not able to achieve the passing score, or able to easily score more than 90%, chances are you will achieve similar results in the actual exam. Click here for TCS Interview questions.
✍ Achieve a Passing score of 75% in the Free Tableau Desktop Specialist Certification Practice Exam below. You will have 45 new questions in every attempt. Time limit is 1 hour. Similar to the actual exam. Please do not refresh the page during the exam. The Datasets for the test are available in the menu above.
Need logic help? Ask for a .twbx Workbook
How to Create a Rounded Bar Chart?

Download the .twbx Tableau Workbook

How to Create a Lollipop Chart?

Download the .twbx Tableau Workbook

How to Create a Barbell Chart?

Download the .twbx Tableau Workbook

How to Create a Bar in Bar Chart?

Download the .twbx Tableau Workbook

How to Create a Stacked Bar Chart?

Download the .twbx Tableau Workbook ✍ A Stacked Bar Chart can be a Simple Stacked Bar Chart, or a 100% Stacked Bar Chart. A Simple Stacked Bar Chart displays the full value of the bar with the corresponding Segment Values. A 100% Stacked Bar Chart shows the percentage of every Segment in relation to the whole value. The below video explains how to create a Stacked Bar Chart in Tableau of both types.


Download the .twbx Tableau Workbook

How to Create a Radial Bar Chart?

Download the .twbx Tableau Workbook

How to Create a Radial Column Chart?

Download the .twbx Tableau Workbook

How to Create a Doughnut Chart?

Download the .twbx Tableau Workbook

How to Create a Pareto Chart?

Download the .twbx Tableau Workbook

Download the .twbx Tableau Workbook

How to Create a Gauge Chart?

Download the .twbx Tableau Workbook

How to Create a Thermometer Chart?

Download the .twbx Tableau Workbook

How to Create a Span Chart?
Download the .twbx Tableau Workbook

How to Create a Waterfall Chart?

Download the .twbx Tableau Workbook

The Tableau Desktop Specialist Certification Practice Exam
Buy Practice Exam
✍ We are delighted to offer you a variety of unique questions in every attempt of our Free Tableau Desktop Specialist Certification Practice Exam above. But if you have exhausted the limits of free attempts on all of your devices, we are glad to present you with our Premium Tableau Desktop Specialist Certification Exam which takes practicing to the next level. ![]() ✍ Our Vision Algorithm, optimized to scan our pool of Tableau questions and deliver curated and unique content with every purchase, provides industry-leading exam experience of the Tableau Desktop Specialist Certification Exam. Choose below and your unique exam will start immediately.
✍ Our Vision Algorithm, optimized to scan our pool of Tableau questions and deliver curated and unique content with every purchase, provides industry-leading exam experience of the Tableau Desktop Specialist Certification Exam. Choose below and your unique exam will start immediately. ![]()
✍ Experience a world filled with Tableau and amazing possibilities in the Premium Tableau Desktop Specialist Certification Exam above. Accelerate your career with incredible fine-tuned questions created by our Certified Tableau Professionals that toughen up your confidence dramatically. ![]() ✍ We also provide Lifetime access at the end of this article. You have unlimited attempts to thousands of questions with the Lifetime plan. A few practice attempts of our remarkable tests is all you need to pass the main exam worth $100. To Sign Up, click below and you will be taken to the purchase page to get the password of the Premium lifetime exam with unlimited attempts.
✍ We also provide Lifetime access at the end of this article. You have unlimited attempts to thousands of questions with the Lifetime plan. A few practice attempts of our remarkable tests is all you need to pass the main exam worth $100. To Sign Up, click below and you will be taken to the purchase page to get the password of the Premium lifetime exam with unlimited attempts. ![]()
Already purchased? Begin exam here. 58% OFF Yearly
Scope
✍ The Tableau Desktop Specialist Certification Exam is designed to evaluate you on your functional skills of using the tool. Are you able to Join two datasets? Can you Blend two datasources? How comfortable are you with Dashboard analysis? Can you filter a data using Sets? Can you draw a Reference Line? Can you create a Table Calculation with Compute by logics? Do you know the concepts of Discrete and Continuous? Are you able to differentiate between the properties of Dimensions and Measures? Can you solve various Practical problems with a variety of datasets on all these topics. We will walk you through in details on how to get prepped up.Essential Training
✍ We recommend taking atleast one complete video tutorial course besides any textual guides or books you plan to read. The best choice is the Official Tableau Tutorial Videos which provides bite-sized crisp learning experience on each topic. The quality of the information and clarity is cutting edge in every video.Real-time Evaluations
✍ Tableau exams are all about learn, practice, repeat. To take your preparation to the next level, keep attempting our free practice tests with intelligent real-time solution walkthroughs, and improved score assessments powered by our Cobalt Algorithm. Each test brings with it an unique set of good stuff for you to learn and practice from our vast pool of Tableau questions. Our Vision Algorithm ensures the questions align perfectly with the knowledge and topics that you need to be aware of.Mandatory Tutorials
✍ Learning Tableau requires some strong foundations initially on which we can build on later. There is an interesting analogy by Elon Musk, the mastermind behind SpaceX and Tesla Motors, to view knowledge as a semantic tree. Make sure you have a robust foundation of the fundamental principles and concepts, i.e. the trunk and the big branches. Only after that, we can move on to the details, i.e. the leaves and the small branches. This approach works remarkably in accelerated learning at later stages. Investing 5-6 hours is an affordable price to pay for each of the below videos to garner crystal clear concepts.


We are often posed with the question on How to pass the Tableau Desktop Specialist Certification Exam since there is such a variety of opinions around it with always changing question patterns. We are glad to let you know that the Tableau Desktop Specialist Certification Exam can be passed effectively with only 12-16 weeks of strategic reading and practical problem solving. If hundreds of our candidates are able to achieve this Certification, there is no reason why you should wait.
We will share our Top Tips to pass the Tableau Desktop Specialist Certification Exam.
Tip #1: Know your Exam
We cannot stress enough how crucial it is for you to go through the Tableau Desktop Specialist Exam Guide and solve it's sample problems. You can download it from the References section of the Menu above. The Exam Guide will give you a crisp glimpse of the entire exam in just a few questions. It is extremely well thought through and you will realize you might be struggling in some of the questions. Keep a note of the questions and then go back to the topics which it pertains to, you may need to improve and read more on those topics.Tip #2: Essential Videos
The Tableau Tutorial Videos are mandatory if you have not taken any online courses. Also make sure to go through the topics in the Tableau Help Guide. Besides that, check out our collection of videos listed in the section above on How to prepare for the Exam? Here we will recommend some more videos for Advanced Learning.On Table Calculations, we recommmend you to go through the below videos to get an exceptional understanding from Tableau Ambassador Anthony Smoak. Another exceptional Table Calculation presentation below by reknowned Tableau Zen Master Andy Kriebel, who is the Head Coach of The Information Lab Data School in London. On Level of Detail (LOD) Expressions, here is a thorough walkthrough on FIXED, INCLUDE, EXCLUDE and more by Bora Beran, Staff Product Manager at Tableau. You are not expected to write calculations during the exam. But it can help you with conceptual questions, or help you get to answers quicker if you want to solve a question by using your own calculations. Parameters form an integral part of Tableau learning, the video below by Andie Kriebel will cover all the essential details in a brilliant way. You will not be asked to create or navigate using parameters during the exam but this knowledge can boost your overall score with crystal clear understanding.


Tip #3: Key Focus Areas
The Tableau Desktop Specialist Certification Exam has Conceptual and Theoritical questions you are required to answer correctly to achieve a good score. The Exam Guide from the References section of the Menu will give you a comprehensive list of all topics. Among them, we advise to take special attention to the below key areas and practice quizzes from our Exams here: Extract vs Live connections, Purpose of .TDS files, Join, Blend, Union, Types of Chart, Analyzing Maps using geographic data, Combined axis chart, Dual axis chart, Stacked bar, Group, Set, Uses of a Context filter, Reference lines, Trend lines, Table calculations, Histograms, Parameters, Shapes, Size of Marks, Add interactive or explanatory elements to Dashboards, Dashboard layout for mobile devices, Story, Sharing a twbx, Dimensions and Measures, Discrete and Continuous fields, Aggregation of Measures.Tip #4: Practice
Practice is at the heart of Tableau. Solving practical problems multiple times daily will make sure you are well acquainted with the tool and can derive any insight whenever asked for. This will come handy during your examination as you can save your energy for the complex problems later, instead of getting exhausted with the easier ones. And with a huge collection of Tableau Desktop Specialist sample questions exactly like what you can expect in the main exam, you have all the tools you need here at LearnTableau.Technology.Tip #5: Google
Google can be a blessing if you know how to use it effectively. Even though you are not permitted to use resources from your local machine or refer books, you can search online for answer to any question. However, do not spend much time if you cannot find an answer for more than 5-10 mins. The rules that apply to searching online are that you cannot login to some website to get your answer, or visit a chatbox to ask your answers.From your online search results, we recommend visiting the links of the Tableau Help Articles first. Often the answers are created in such a way that the verbiage will exactly match with the Tableau Help Guide. If you cannot find your answers in the Tableau Help Guide, move on to the other search results. Wherever possible, try to answer the questions using Tableau Menus and Navigations instead of searching online. Questions like how many types of Trend Models are available for a Trend Line can be best answered using the tool itself.
Tip #6: Get to the answer
Tableau does not restrict how you arive at your answer as long as you get it right. Thus whether you write a FIXED calculation to derive Customer Sales for 2019 or whether you use a Year filter and get to the required Sales figure does not matter. The Tableau Desktop Specialist Certification Exam does not require you to write calculations, but that does not mean you cannot if you want to, often it helps get to answers quicker if you are comfortable with LOD and Table Calculations.
Optimizing your Score
Tableau assesses your skills on different categories - Concepts, Connecting and Preparing Data, Analyzing Data, and Sharing Insights. You can download the Specialist Guide from the 'References' in the Menu above. Being strong in only one area and appearing for the exam can prove fatal. Unless you are well adept in every area, you are taking a gamble on your luck. Improving your score in Tableau is possible only through rigorous practice and well-planned topic areas to study. If you would like further guidance, take our practice tests, or use the Contact option from the menu and reach out to us. Mention which email id you used to give our practice exam along with the date and time. We will review your results and send you a personalized feedback.Continuous Assessment
Tableau does not provide you detailed assessment score breakdown results after you complete the Certification Exam, so you will never know which questions you need to improve upon or which questions you answered correctly. That's why taking our Practice Tests is critical where we provide you real-time results as you progress. Tableau clearly states that their exams are designed to measure skills, not enable skills. Hence their report only shows high level topic areas with percentage scores without further granularity.Understanding Dumps
Well, it is no wonder that we are all enticed by a notion of a Tableau Desktop Specialist Certification Dumps, that can enable us to pass the coveted Desktop Specialist Certificate with lifelong validity within a couple of days. But it can prove fatal during your exam if we take a route of Dumps. We encourage Learning Tableau. The concept of Dumps is not appreciable at all. It never helps learning, and is counter-productive. So if you are looking for a quick way to pass the test, Tableau does not work that way.Accessing our Dumps
However, if you can pass all our quizzes comfortably, chances are high you will pass the main exam. The Tableau Desktop Specialist Dump PDF can take a break for awhile. Tableau strongly emphasizes you must practice with the tool before appearing for the exam, that's why we request you to practice all our tests prior to the main exam. You can read more at our Tableau Certification Dumps.Introduction
Let's discuss a topic which can help us during the Tableau Desktop Specialist Certification Exam. If we have worked in a data base that has significant gaps in its data collection, we know it can keep us from viewing a complete picture of our entire data set when we import it into Tableau for analysis. We will have to scaffold as Tableau will just represent rows of data where there is an empty row representing a missing field or key. We can easily create a data scaffold from Tableau. Let's find out how to do this using Tableau.Or perhaps, a situation where we have to fill in the missing dates and values to present it based on the requirements. Data Scaffolding technique is a great way to create visualizations that are not possible with the original data source. This technique saves time and effort for the data architecture. Knowledge of these techniques can come useful in the Desktop Specialist examination.
What is Data scaffolding
Data scaffolding is an artificial technique to create a data structure for the purpose of better or fill-in-the-gap visualization. In short, it reshapes the data structure to fit the design of the visualization.
The majority of companies these days are using data management systems as part of their business practices. Tableau has been making its way into the medical industry as well. Data scaffolding helps data administrators create, view, and manipulate data without having to learn complex SQL and Java. Problems requiring scaffolding are common in the Tableau Desktop Specialist Certification Exam. A visualization specialist can create charts and graphs in Tableau that show exactly what the data would look like if stored in a relational database.
The scaffolding and joining techniques shared here are helpful at any time when we need to combine data sources for different analysis levels. This is especially useful for applications where the scaffold data set may still require blending, but the modeling methods can be changed depending on how we want to handle the joining, such as using a contribution in conjunction with Data Ink Ratio Animation and how to apply it in Tableau. Scaffolding can also be useful to fill gaps in the data source, especially when trying to represent values from multiple data sources.
Data Pre-Processing
Data Scaffolding is Data Pre-processing too. Data pre-processing describes the processing that is carried out on raw data before preparation for the processing processes. In general, data pre-processing is the process of transforming the raw data into a format similar to the format that is being studied and processed, but in a different way. The feature encoding performs a transformation of the data so that it can be accepted as input into an analysis, visualization or machine learning algorithm without losing the original meaning encrypted by the features.
Data Pre-Processing can be performed by using various method but the most common ways are by using in-built Tableau functionalities, Excel, or Python Script. Data Pre-Processing requires not only patience but attention to details in finding errors in the dataset as it would affects the quality of the result. Garbage in and Garbage out. So need to be careful for such types of problems to accurately perform pre-processing during the Tableau Desktop Specialist Certification Exam.
Case Study
Be it that you are a student or someone in the Data field, real world data are no rainbows and magic. Real world data could be really messy or noisy as it may contains a lot of missing data, errors, inaccurate values and so on. Data cleaning or Data Pre-processing is the part where patience takes place as we would need to design and clean the data so it would suit the visualization as required.
Scenario
Sarah is given 2 columns of data to perform a high-level analysis for a client but the client would love to have daily data analysis. The data presented by the Client is taken from xxx API and the API would only provide monthly user data.
How to create daily date from monthly data?
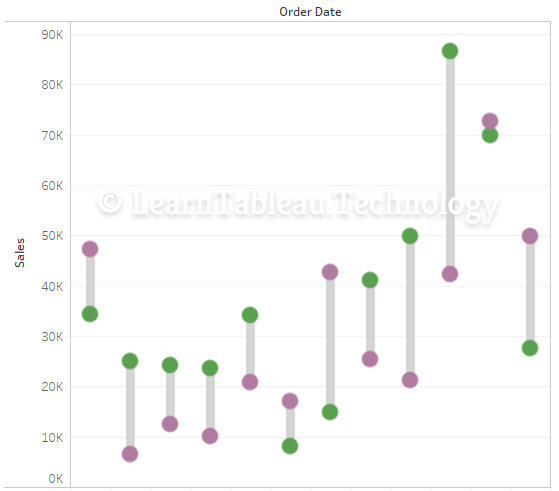
Data Scaffolding could address the issue by creating an artificial sheet to support the missing date values. The end goal of this issue would be creating a daily date skeleton column out of the Monthly Date Column and populate the daily users' values by calculating Average Users Per Month.
Desired Result:

How to create daily date from monthly data? (Step By Step Guide)
Step 1: Create a new sheet with a list of Date (e.g. 1-Jan-2020 to 31-12-2020) with Excel, save as “Date.csv”.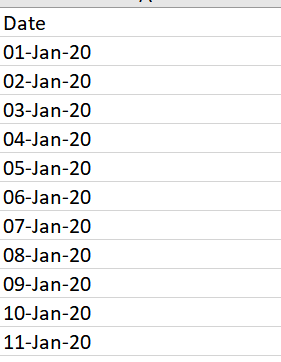
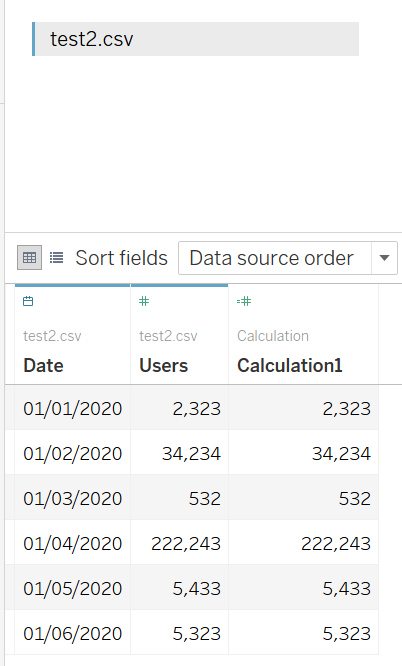
Step 2: Import the original data source.
Step 3: Import the “Date.csv” files -> Click On “Full Outer”
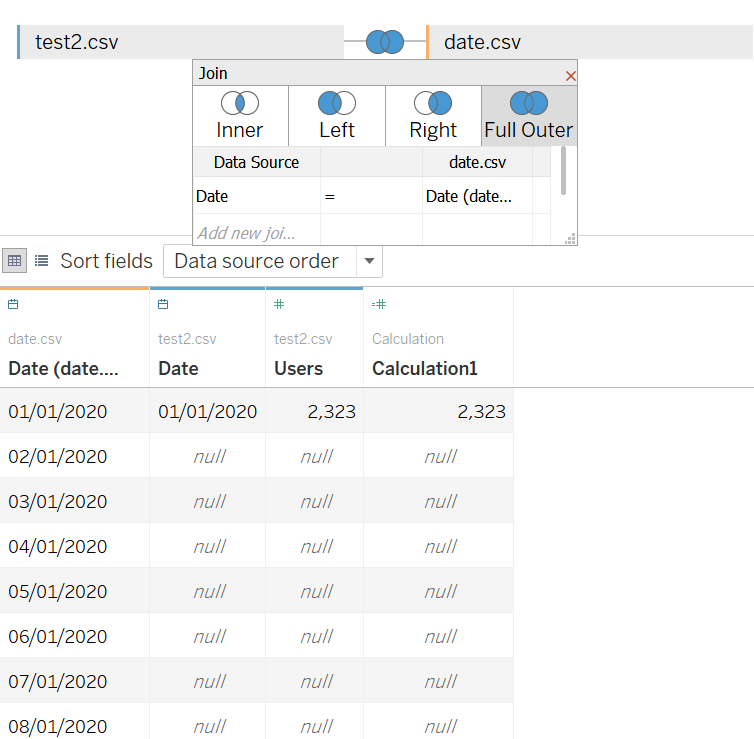
Step 4: The Join should result in the table below. In this use case, we would replace the Average Number to the blank rows. (e.g. 1st Jan 2020 has an Average of 2,323 Users)
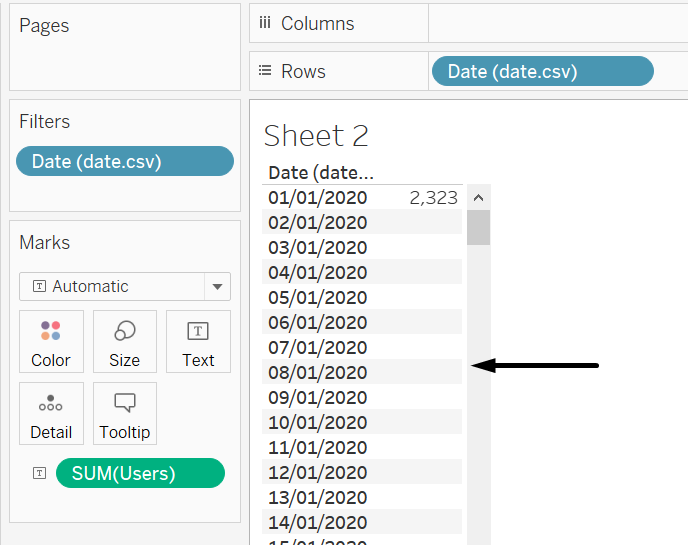
Steps Breakdown (Data Scaffolding)
Step 1 : Create a Date (1-Jan-2020 to 31-Dec-2020) list in Excel Sheets, Save As “ Date.csv”Step 2 : Import Original Data Source (yourData.csv or any source) into Tableau
Step 3 : Import “Date.csv” into Tableau
Step 4: Perform Outer Join between (yourDate.csv and Date.csv)
To Fill In The Blank Values
Step 1 : Right Click on Measure Pills ( Sum(Users))Step 2 : Select “ Add Calculation Table”
Step 3 : Select “Running Total” as Calculation Type
Step 4 : Compute Using “Specific Dimension”
The steps above would resolve the issue of creating daily date out of monthly data without needing help from a database or SQL expert within Tableau!
Conclusion
The great thing about the Tableau software is that it can deliver quality analysis results even without any programming knowledge. One of the reasons it has become so popular is that its drag-and-drop interface is relatively easy to use, and users without programming knowledge can easily manipulate the data to create a variety of interactive visualizations. This knowledge is thoroughly evaluated during the Tableau Desktop Specialist Certification Exam.
However, to be an exceptional Tableau Developer, it is important to understand that Tableau is something beyond drag and drop, it is very flexible and customizable based on requirements. There are a lot of workarounds in achieving the end goal of a dashboard. At times, we would not need to modify the database.
On the other hand, it is important to understand the data structure. Data Structure would assist us in designing a better functional dashboard rather than merely showing the generic reports. It is really useful during communications with the backend guy when we need their professional help in building the data source. Furthermore, we could do a simple query from the Database without the help of the backend guys too to speed up our dashboard.

Certificate Validity
The Tableau Desktop Specialist Certification does not expire. Unlike the other Tableau Certificates, this Certificate is always valid and can be used to demonstrate your fair understanding of all the essential capabilities of Tableau. You can also find this Tableau Certificate Validity information in the official Tableau website.Retaking the Test
You can again appear for the test if you fail the first attempt. Use the Schedule option from 'References' in the Menu above and you will be set. However, we advise you to assess what happened in your last attempt. If required, Contact us from the Menu above with your score details and we can suggest you if any specific area needs more practice for you. There is no required waiting period between your first and second exam attempt. Should you need to take the exam a third time, there is a two month waiting period between each attempt after your second.

Overview:
✍ The Tableau Desktop Specialist Certification Practice Exam and Sample Questions below will give you an experience of what the Actual Exam feels like. The Exam can be purchased at Pearson VUE from the Schedule Exam option in the References section of the Menu above. While creating your account, make sure to provide your name correctly as per a government issued ID as you cannot change it later. To change your name later, you have to contact Pearson VUE with verification documentations.ID Vertification:
✍ Pearson VUE has very specific guidelines regarding Identity Verification Process and the types of eligible documentations accepeted as proof of identity. Here are the details for the Tableau Desktop Specialist Certification Exam. General: ○ All IDs must be valid government-issued in their original form (not a photocopy) ○ Acceptable IDs include: International travel passport; driver's license; identification card (national, state, or province ID card); alien registration card (green card or permanent resident/visa) ○ By law, certain IDs must not be photocopied, digitized, or captured on camera. Because of this, Pearson VUE cannot accept restricted IDs as identification for online testing, including the U.S. Department of Defense (DoD) Common Access Card (CAC) or certain secure access IDs. Name requirements: ○ IDs must include the candidate’s name ○ The first and last name on the ID must match the first and last name the candidate used to register for the exam. Photo requirements: ○ ID must include a recent, recognizable photo Candidate under 18 years old: ○ During check-in, parent/guardian must present their own ID and give consent for candidate to be recorded. Candidate also to present government issued ID if they have one, or student ID if they do not have one.ID Authentication:
✍ OnVUE uses a mixture of artificial intelligence and a live greeter to diligently check ID submissions to authenticate your identification. Pearson VUE does this to verify each candidate's identity and to protect the security and integrity of the test. If required, the proctor may ask that you retake a photo of your identification before your exam can start if the image is blurry or illegible. If there are any discrepancies during the check-in process, you may be prohibited from starting your exam. You may not be allowed to reschedule your test appointment, and you may forfeit your test fee.
Time Slots and Time Zones
✍ Once you purchase using a Visa, Master Card, American Express or Visa Debit or Credit card, you can schedule your Exam. You will be able to choose a time slot as per your convenience on next screen, with extremely flexible options in both AM and PM hours. The times represented reflect the local time associated with your computer. If your computer's time zone is set to the time zone you wish to schedule in, select a time, otherwise you will need to change the time zone in your profile.Rescheduling and Refund Policy
✍ To Reschedule your Exam with Pearson VUE, you need to do so atleast 24 hours before the exam. Failure to reschedule in time or failure to appear for your appointment will result in the forfeiture of your entire exam fee. Read below what Pearson VUE says in it's guidelines for the Tableau Desktop Specialist Certification.
Missed Exam
✍ If you do not show up for the Exam the entire fee of the exam will be forfeited. You need to inform regarding your unavailability of a scheduled exam atleast 24 hours in advance. Pearson VUE has very clear rules and guidelines regarding reschedule and cancellation policies, and failure to notify atleast 24 hours in advance will always forfeit your entire exam fee.✍ The Tableau Desktop Specialist Certification Exam forbids utilizing online, public resources within the virtual exam environment such as Google. You are not allowed access to your local machine or any site allowing for interactive communication. You cannot access any websites and are not allowed to take notes or have any material on your desk.
The Exam requires you to agree to the below conditions to proceed with the examination:
Rule #1:
You must store personal items away from your testing space for the duration of your exam. If you refuse to store your personal items, you will be unable to test and you will lose your test fee. Please note that, if you need to use your cell phone during check-in, you may do so. However, prior to starting your exam, you must place your phone out of arm’s reach. It needs to be available should Pearson VUE need to contact you.Rule #2:
You must stay within your webcam view. No one else must be able to view your computer or monitor, even through windows.Rule #3:
You cannot get up and walk around. To ensure a high level of security throughout the testing experience, you will be monitored at all times. Both audio and video may be recorded.Rule #4:
No one can enter your testing environment. Ideally, you should prevent others from entering. If someone does inadvertently enter, say “Please leave; I’m testing.” No other communication is allowed and could lead to your exam being terminated.Rule #5:
You cannot leave your testing environment.Rule #6:
A beverage in any container is allowed, but no food or smoking.Rule #7:
You cannot move your webcam once your testing session has started.Rule #8:
Mumbling or speaking out loud will lead to a warning.Rule #9:
Headphones and headsets (wired or Bluetooth) are not allowed unless explicitly approved by your test sponsorRule #10:
Keep it quiet. Background noise may distract proctors monitoring your exam session and could interfere with your session.Rule #11:
Avoid interruptions. Inform any other members of your household that you are taking an exam and cannot be interrupted during your entire appointment time.Rule #12:
Ensure enough light. Proctors must be able to see you and your testing space well. Do not sit in front of a window or other strong light. If you are backlit, you are not clearly visible (draw shades or curtains and/or turn off lights behind you).Rule #13:
Nothing in arm’s reach that is not specifically allowed. Your exam program will indicate any equipment or materials specifically approved for use during an OnVUE exam; these must be on the desk during checking.Rule #14:
The following items are not allowed in your testing space: ○ Cell phones, hand-held computers/personal digital assistants (PDAs) or other electronic devices, pagers, and watches ○ Wallets or purses ○ Firearms or other weapons ○ Hats (and other non-religious head coverings), bags, coats, jackets, or eyeglass cases ○ Barrettes or hair clips larger than ¼ inch (½ centimeter) wide and headbands or hairbands larger than ½ inch (1 centimeter) ○ Jewelry that is removable and larger than ¼ inch (½ centimeter) ○ Books or notes unless specifically authorized by the exam program for use during your testRule #15:
A connection failure or interruption can interfere with, or even end, your OnVUE testing session. Use a wired internet connection rather than WiFi, if possible. If using WiFi, ask that other household members do not use the internet during your exam. Disconnect any VPNs if you have them; OnVUE does not work well with VPNs.Rule #16:
Required device is a desktop or a laptop; tablets and touch screens cannot be used for your exam.Rule #17:
A single monitor is required. Extra monitors are not allowed; you should remove them from the testing room, or at least show them as unplugged in your testing environment photos.Rule #18:
If using an external monitor with a laptop, you must have an external mouse, keyboard, and webcam and the lid of your laptop must be closed.Rule #19:
A personal computer is recommended rather than a work computer, which may have additional security that can interfere with your testing session.Rule #20:
You may be subject to additional potential inspections, including the following: ○ A proctor may ask you to show your ears if you have hair that covers your ears, for the purpose of verifying that no Bluetooth devices are present. ○ A proctor may ask you to roll up your sleeves to verify that you have no writing on your arms. ○ A proctor may ask you to empty your pockets for the purpose of ensuring nothing is in them. ○ A proctor may ask you to complete a full 360-degree room scan either during check-in or during your exam.System Setup:
✍ The Tableau Desktop Specialist Certification Exam requires an environment with optimal connectivity speed more than 3 Mbps download/upload, 4 GB RAM or more, the newest versions of Microsoft Edge, Safari, Chrome, and Firefox, webcam with a minimum resolution of 640x480 @ 10 fps, microphone and an isolated seating arrangement. Internet Cookies must be enabled. ✍ Make sure you are connected to a power source before starting your exam to avoid draining your battery during the exam. You may have the option to use your mobile phone to complete the check-in process. The mobile phone must have Android (7+, Chrome) and iOS (12+, Safari) operating systems. ✍ Before you sign up for an OnVUE exam, find out if your computer and connection will work. Mac users may need to allow OnVUE within their ‘System Preferences: Security & Privacy: Privacy’ settings for Microphone, Camera, Automation and Input Monitoring. Go to your testing program’s OnVUE webpage, click Test my system, and follow instructions. We at Learn Tableau provide a dedicated Pearson VUE System Test right now to get you started. On the actual exam day, you will be again prompted a second time to ensure you have tested your system.
✍ If you run this test using the same computer and internet connection you plan to use for your exam, you can feel confident about your setup. Plus, you get a preview of the check‑in process and launching an exam. ✍ Run the system test at about the same time of day you expect to take your exam to get a better feel for the internet connect you are likely to have. If you run the system test at 10:00 pm and take your exam at 2:00 pm, the bandwidth available may be quite different. The below screen shows a step during the Tableau Desktop Specialist Certification Exam on the actual day of the exam.

System Diagnostics:
✍ Tableau and Pearson VUE ensure that your computer meets all the pre-requisites of the exam. An extremely thorough and well-designed system equipments check is conducted with focus on microphone, webcam and speaker as well. Each of the system devices need to pass a check for your computer to be deemed eligible.

Pearson OnVUE:
✍ OnVUE is used by Pearson VUE to conduct their online proctoring during the examinations. It is a robust software that ensures that candidates are giving the exam honestly and genuinely, without any outside interference or unethical practices. OnVUE euses face-matching technology, live greeter, and allows you to give your exams from your home without visiting a test center. We encourage you to run a system test now. A system test during the day of the actual Tableau Desktop Specialist Certification Exam will look like below.
Environment Review:
✍ The Proctor will then require you to rotate your webcam 360° to make sure you are alone in the room, your desk is clear, and there are no unauthorized display screens or monitors around you. This essentially requires standing up with your laptop and turning it 360° so that the Proctor can see. If your connection fluctuates, or there are miscellaneous items in your room or desk, this step can take awhile.How to start the check-in:
✍ To start your OnVUE exam, sign in just as you did when scheduling it, either on your exam program’s website or on the Pearson VUE webpage for your exam program. Then find your OnVUE exam and click the Begin Exam button to start the checkin. Note: Checkin is available 30 minutes before to 15 minutes after your scheduled appointment time—the Begin Exam button is displayed only during that time. ○ Click the Copy Access Code button when you see it; the access code is your unique code for your OnVUE testing session. ○ After you download the OnVUE application, you must run it manually either from the screen you are on or from the folder it was downloaded to; for security reasons, OnVUE is not run automatically. ○ After OnVUE starts, close all other applications running on your computer. OnVUE’s secure browser attempts this automatically, but this could disrupt your exam start. On Microsoft Windows, press Ctrl+Alt+Del to access Task Manager. On a Mac, press Command+Option+Esc to access Force Quit. ○ Successfully completing your check‑in early will not allow you to start your exam early.Photo Guidance for Checkin and ID:
A mobile phone works best for capturing the required headshot, ID, and environment photos, but you can use a webcam if you don’t have a mobile phone. Headshot photos: Your headshot is compared to your ID photo to make sure the right person takes the exam; it may also be included on your score report. Tips for taking headshots: ○ Take your headshot in front of a solid background using good lighting. ○ Prompts will indicate any adjustments needed to get a good photo — just follow the instructions. ID photos: Pearson VUE uses your ID to verify your identity. Photos required depend on the type of ID used: ○ Driver’s license, government-issued ID, or other approved ID card: Capture front and back. ○ Passport: Capture photo page only. ○ Testing environment photos: You are required to take four photos of your testing environment during the checkin. Try to get clear shots. They are used for the proctor’s reference during the testing session and for quality control, security, and auditing purposes. Pearson VUE deletes checkin photos according to regulations in the country where you test.You are being recorded
✍ Once you submit your photos and arrive at this screen, you are being recorded and your photos are being reviewed by an OnVUE greeter. The greeter will either start your exam without contacting you or will chat/call you to work through any issues. When the exam is started, if you either leave the webcam view or are using your mobile phone while waiting, your exam will be revoked.
Feel at Home
✍ As you start answering the questions, you will realize the questions are similar to the ones you practiced above at the Free Complete Tableau Desktop Specialist Certification Practice Exam, the Premium Tableau Desktop Specialist Certification, the Premium Tableau Connecting Data Exam, the Premium Tableau Analyzing Data Exam, the Premium Tableau Sharing Insights Exam, and the Premium Tableau Concepts Exam. Our extremely affordable brilliant exams will now help you breeze through the main Exam questions.Slow and Steady
✍ There is no need to rush as there is ample time, if you have been able to pass our Practice Exams above, you will comfortably score more than 90% and also finish answering all the questions in 40-45 minutes in this Main Exam. The questions are multiple-choice and some have more than one correct answers, so besides radio buttons you also have checkboxes. You cannot access Google or the internet from the browsers inside the Virtual Machine. You cannot use any application from your local machine during the exam. The PDF version of the Tableau Help Guide will be available to complete the hands-on sections.Mouse, Keyboard & Display
✍ Since you will working in a Remote Virtual Machine, your mouse clicks and response times will often be delayed by a few milliseconds, not enough to hamper the exam though. Also Alt+Tab might not work to switch between windows in your exam environment since it is in a virtual machine, you can switch windows manually which is what most candidates do. Or else if you have the luxury of a large screen monitor, you might put the questions window and Tableau application side by side as you answer the questions. Make sure to read more on External Monitors in the Rules of the Exam section above.Mark Questions for Later
✍ As a best practice, we recommend flagging and marking questions that might require online searches, or if you are not sure of, and then skip to the next one. Once you reach the end of a section, after finishing all the questions you were confident in, revisit the marked questions one by one. This enables efficient use of your time, nervous stability, and moral energy. Among the three sections of the exam, Tableau prohibits candidates from going back to a previous section of the exam once they have moved on to the next section.Technical Issues
✍ Your OnVUE proctor attempts to resolve technical issues in real time. If the issue cannot be resolved, the proctor files a case on your behalf. This leads to one of two outcomes, depending on when the issue occurred: ○ Before the exam started: Pearson VUE may either reschedule your exam appointment or cancel your appointment, which provides you a refund or reinstates your original voucher where applicable. ○ During your exam: Pearson VUE will provide a voucher for a new appointment.Use Clean Sheets
✍ As you address each question, you will realize the need to make different joins, edit the data source, blend, filter, and various other customizations to answer a question. For the next question, even if it uses the same data source, and part of the question seems similar to the earlier questions, do not spend time reusing and modifying the old sheet. Start off with a clean workbook or worksheet for every question. This is a key tactic followed by successful candidates.Rename the Sheets
✍ To optimize your review at the end of the exam, it is preferable to rename the worksheets with your question number to allow you to quickly refer the correct sheet. For multiple choice questions, make sure to select all possible answers that are applicable to that question by selecting the checkboxes. Often a choice may seem out of place, if required spend a couple of minutes to verify if that choice should be selected or not.✍ The Proctor plays a critical role throughout the Tableau Desktop Specialist Certification Exam to make sure you successfully complete your exam. The role can be categorized into Identity Verification, System and Configuration Setup, Accessibility Enablement, Rules and Regulations Enforcement, Supervising the Exam, Addressing Adhoc Accessibility or System Issues during the Exam, Ensuring Closure of the Examination. The Proctor also has a set of guidelines that they will follow and verify in order to proceed as per the process for a successful examination. ✍ Once you've completed all of your required check-in steps, you will see a page that states, “You are almost done with the check-in process”. Please be patient as Pearson VUE teams are usually checking in candidates who are in the queue. Most candidates will have their exam launched by a proctor within 15 minutes of the exam appointment. If you are experiencing a longer delay, there may be a problem with your photos or your internet connection. If there is an issue with your submitted photos, a proctor will attempt to reach you over chat or your cell phone. The incoming phone number may be unfamiliar to you but please answer so that Pearson VUE can help you. If Pearson VUE haven't contacted you in 30 minutes, they may have lost connection to you and their team has been unable to reach out to help resolve this issue. Please reach out to Pearson VUE customer service team via chat if you require assistance. ✍ Normally, you shouldn’t need to. If you are disconnected from the proctor and cannot resume your OnVUE exam, Pearson VUE will create a case on your behalf. If you want to raise the issue yourself, however, you can contact Pearson VUE Customer Support by chat or phone. Chat is available 24 hours a day, seven days a week. Phone support varies by region. Find phone support information for your region on the Pearson VUE Customer Support webpage. ✍ As you go through the check-in process, remember that the proctors aren’t trying to make things difficult. They’re just trying to uphold the integrity of the exam, which should be important to you, too, since you’ve worked so hard to earn the certification.
✍ In your personal Account when you sign in, the Pearson VUE Dashboard is a useful location to find many important resources. You can schedule and reschedule your exams, access your exam history, etc.


The Tableau Desktop Specialist Certification Practice Exam
Become a Lifetime Tableau Member above at an extremely affordable price to get access to 1000+ questions, continuously Growing, and Unlimited attempts. You will never need to purchase any other test again. The era of Data Visualization is just beginning. We are just starting to realize the delights of insightful data interpretations. Tableau is growing by leaps and bounds with feature-rich version launches more frequently than ever. Having a Tableau certification will help you recognize your skills in the Data Analytics world, though having a certification is not mandatory. With diligent practice and practical use-case understanding, you can build an impressive portfolio where interviewers will be glad to have you onboard. A Tableau Public profile is also not mandatory, all that matters is your problem-solving ability and explaining how you used your expertise to overcome obstacles and arrived at creative solutions. Keep reinforcing your understanding of the business needs and how you helped the greater overall strategy of the business and you would be equipped enough for a much coveted analyst position.


