Tableau is really a great reporting tool where we can build visualizations to enhance your business. Today we are going to learn about how to build an awesome Ribbon chart or Stacked Area chart in Tableau. It is a series of area charts stacked one on the top of the other area chart. Area chart is the simple line chart but the area between the line and x-axis is colored on the basis of theme.
The area charts are used to represent the quantity changes over time. Also shows how the change of one quantity affects the composition of other quantities. The Stacked Area Chart is awesome here! So let’s see how this Ribbon chart/Stacked Area chart can be created in just a few steps with less time. We will use a ‘Sample Superstore’ dataset to create this visual. One can use a dataset as per their wish. Here is how Stacked Area chart looks like and steps to create this chart:

Step 1: Connect to data
To start creating any visual in tableau, always you need to
connect to a dataset you have handy.
Step 2: Create a simple line chart
Drag SUM[Sales] into rows shelf and [Order Date] in columns shelf. Now, Right click on [Order Date] and select Quarter. You will see your visual seems like this-

Add [Region] to the Color shelf in the marks card.
Now you will see the chart will look like this:

Now In the marks card change the chart type to area instead of
line chart.
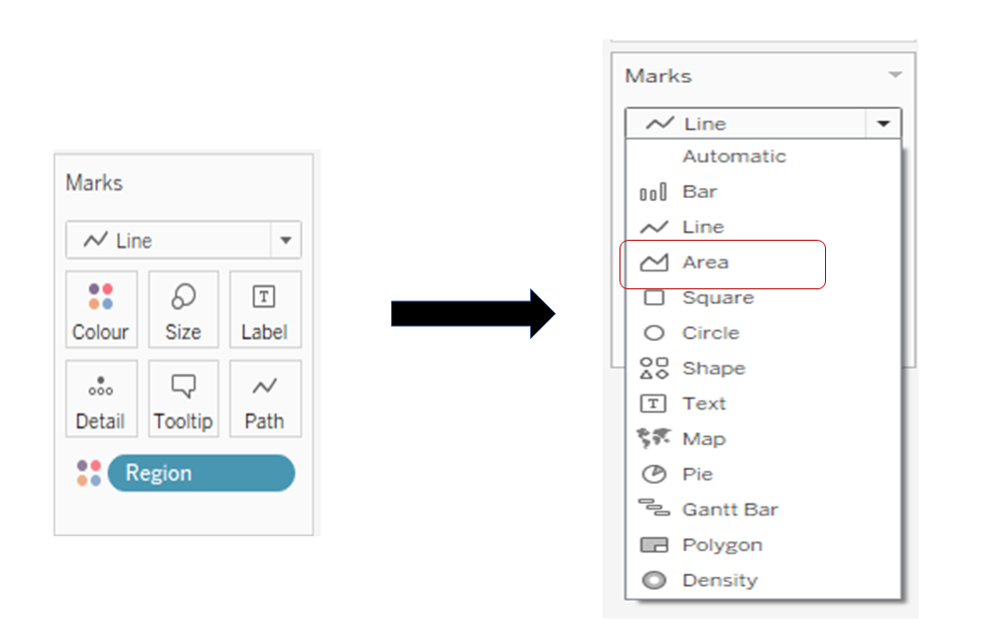
You can see the well built Stacked Area Chart as below.

You can format this visual as per your wish to do it.
Advantages of Stacked Area chart:
This chart can be used only when you want to track not only the whole sale or transactions, but also want the breakdown of that total value by groups. To get the idea about how one group of data is compares to the other on the basis of their contributions to the total value.
Thank
you!


