Gartner Report

Purpose of the Exams

Let's Begin
Learn more on the Tableau Desktop Specialist Certification to master essential Tableau skills. Challenge yourself with the coveted Tableau Certified Data Analyst Certification to demonstrate your proficiency in Tableau. Answer the latest Top Tableau Interview Questions as of to refresh yourself. Our questions span from Connecting Data, Analyzing Data, creating Calculations, developing Insightful Dashboards, critical Tableau Concepts, the latest Job Interview Questions, and more. The below test will give you a glimpse of what we have in store for you. Score 70% from 10 questions in 20 minutes to pass the exam. The Datasets for the Exam are available in the Menu above.Buy Practice Exam
We provide unlimited opportunity for you to learn and practice Tableau, for free. However, there is a limit to the number of attempts in our free tests. We are glad to present you with flexible plans to access more of our contents. Each attempt brings with it 10 Premium questions, from all Tableau categories like Dashboards, Level of Detail Calculations, Order of Operations, Blends, Joins, Sets, Groups, Chart Types, and more.✍ Discover the latest trends in the industry and job market with the included Tableau Interview Questions in each attempt. Experience actual problems and practice hands-on to enhance your skills on key topics.
✍ Improve your skills with Unique Set of Questions in each attempt. Challenge yourself with questions chosen randomly from a vast pool of 1000+ Conceptual and Practical problems using our Vision algorithm.
✍ Expect these questions in any of the Tableau Certification Exams and Tableau Interviews you are preparing for in . Learn from the freshest insightful questions built on the latest Tableau versions.
Tableau Desktop Specialist Certification
✍ The Tableau Desktop Specialist Certification costs $100 and there is no eligibility criterion. This test evaluates essential skills of using Tableau Desktop and your ability to use all the analytical functionalities of the tool. Our recommended hands-on Tableau experience before you attempt this test is 12-16 weeks.✍ You can predict your performance by checking your score in the Tableau Desktop Specialist Practice Exam. You have to score 75% from 45 multiple-choice questions in 60 minutes to get the certificate. The Tableau Desktop Specialist Certificate does not expire. To schedule the exam with Tableau when you are ready, choose 'Schedule Exam' from the References Menu above.
Tableau Certified Data Analyst Certification
✍ The Tableau Certified Data Analyst Certification costs $199 during beta stage and there is no eligibility criterion. This test assesses advanced knowledge of using Tableau Desktop using Level of Detail Expressions, Order of Operations, and more. Our recommended hands-on Tableau experience before you attempt this test is 20-24 weeks.✍ To predict your performance in the actual exam take our Tableau Certified Data Analyst Practice Exam. You have to score 75% from 70 multiple-choice questions in 150 minutes to get the certificate. The Tableau Certified Data Analyst Certification has a validity period of 2 years. Tableau offers 40% discount on renewal of the Certificate, so you will pay $150 instead of $250 for the Tableau Certified Data Analyst Certification renewal. The current price is lower in the beta stage at $199. To schedule the exam with Tableau when you are ready, choose 'Schedule Exam' from the References Menu above.
How to Create a Rounded Bar Chart?


How to Create a Lollipop Chart?


How to Create a Barbell Chart?


How to Create a Bar in Bar Chart?


How to Create a Stacked Bar Chart?


How to Create a Radial Bar Chart?


How to Create a Radial Column Chart?


How to Create a Doughnut Chart?


How to Create a Pareto Chart?


How to Create a Gauge Chart?


How to Create a Thermometer Chart?


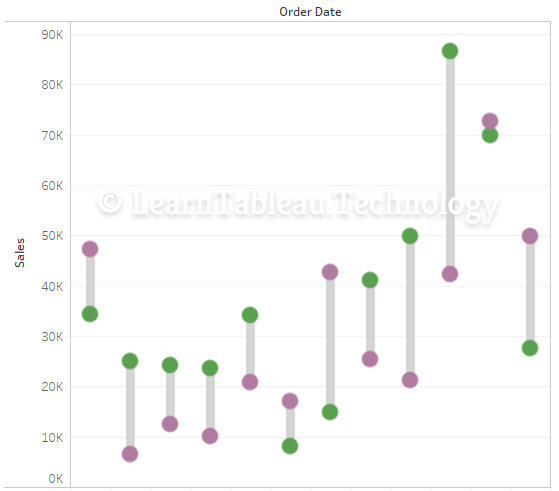
How to Create a Span Chart?

How to Create a Waterfall Chart?


We are passionate fans of Tableau, so we are excited to share with you our favorite collection of top tips and tricks in Tableau. Here is a collection of amazing techniques that you will find interesting. If you are just starting to learn Tableau, we recommend you first watch through the excellent videos we curated for you at Where to Learn Tableau?.
The first video below demonstrates a variety of interesting techniques using Tableau to create elegant visualizations. It is presented by Alan Eldridge of Tableau Software. It encourages you to become a Tableau Jedi, i.e. a master of the magical world of Tableau visuals.


Data as a term is the center of attention when speaking of Tableau since it is known as a great business intelligence and data analysis tool. In order to be able to work with Tableau, first thing we need to learn and understand data and all its underlying features. We need to understand how different data types are used, how it is managed, merged, filtered, extracted or any other action available in Tableau. But first thing, first. In this article we will be elaborating about the different types of Tableau and how we can change them.
What Kind Of Data Types We Have In Tableau?
Data values into its definite type are characterized by the data types. The data type of data values that are only text is string (ex. ‘Region’), since this value contains only characters. Other data values that contain only whole numbers (ex. 45739), their data type will be an integer. If a certain data value is in a form of a date or time ( ex. 2020-10-20 or 07:25:30), then its relevant data type will be date/time. Likewise, every data value has its own data type. Which means that all the data values fall under a specific category of data type, not one is left aside.
For higher transparency and efficiency, Tableau has created its own set of data types on which it characterizes every data value. Primarily, there are seven main data types used in Tableau. As soon as the data gets uploaded to Tableau, a certain data type is assigned to that field since Tableau is able to detect the data type in the field immediately. Even though a primary data type is assigned to the data field itself, you can afterward modify it.
The seven main data types are:
- String values
- Integer (number) values
- Date values
- Date & Time values
- Boolean values
- Geographic values
- Mixed (cluster) values
|
String
values |
 |
|
Integer (number) values |
 |
|
Date values |
 |
|
Date & Time values |
 |
|
Boolean values |
 |
|
Geographic values |
 |
|
Mixed values |
|
Data Types in Tableau
Let's dive into each Tableau data type in detail.String Data Type
Further, the string data type is
split into two main categories. Char and Varchar.
- Char string type - All the values which
are defined with this data type have a fixed length. The memory regarding
the fixed length is assigned to char string values in tableau. That being
said, if you try to enter a string value whose length is more than the
fixed length, Tableau will show an error. Usually, the alphanumeric data
values are the ones stored for this data type.
- Varchar string type - As a contrast, the
length of the varchar string type is variable, with no predefined length
of the characters that can be entered. Since there are no memory allocation
restrictions, you can able to enter as many characters as you want.
Alphanumeric data values can also be found in this string type.
Numeric data type
The numeric data type stands for
values that consist of numbers. These values can be either, an integer type or
a floating type. The integer type is a more common numeric data type since
float values can create difficulties for the users in the process of
accumulating the decimals after a certain limit. However, by using the Round
function you can round up the float values to corresponding integers and
then, they can be easily used in calculations.
Date and Time Data
Types
Tableau accepts many formats of
date and time. For example, dd-mm-yy, dd-mm-yyyy, dd-mm-yyyy hh-mm, mm-dd-yyyy
etc. Some fields contain only date value (ex. dd-mm-yyyy) while others can have
a time along the date like a timestamp ( ex. dd-mm-yyyy hh-mm). The date and
time values can be expandable from decade, year, quarter, month, day, hour,
minutes, seconds etc. There is also a workaround in order to transform the date
value in the form of string characters. By adding a # sign before the date (
for example, #22/10/2020), Tableau registers this field as a string. Under this
category, there are two data types - Date type and Date & Time type.
Boolean Data Type
The Boolean data type are actually
values that are the result of some relational calculations. That being said,
the Boolean values, True and False, are also known as logical values. If
otherwise, the result of that specific relational calculation is unknown, the
value for it will be shown as Null.
Geographic Data Type
As obvious from its name, the
geographic data values are all values that can be used in a map. To clarify,
these values are country, state, city, region, postal codes etc.
Mixed or Cluster
Data Type
Even though it is more rare,
sometimes a field can not be characterized under a specific data type because
it doesn’t consist of a single data type. These values have a mixture of data
types. These values are known as mixed data values. In this situation, you have
two choices. You can either manually handle these fields by separating them
into different data types or just let Tableau take care of it.
Changing Data Types in Tableau
As an ideal situation, Tableau is
able to detect the data of every field and assign the accurate data type to all
existing fields in the data source once you upload it. However, even Tableau
sometimes is not able to properly read the data in the field or just, you want
the field with another data type so you can use it differently. Don’t worry.
Tableau offers many ways at many stages while working, to change the data type
of a field. Three are shown below.
In
Data Source page
If you are in that stage when you are just creating your Data Source and cleaning it up so you can use it more efficiently later, you should consider changing the data type of a field here. To change the data type in the Data Source page, you should click on the data type icon. Then, a drop down menu will appear with all data types. You should select the new data type and it will automatically allocate it to the values of that field.

From
Data Pane
Once you have created your data source and uploaded in
Tableau, all the data fields from it are shown in the Data Pane of a certain
Tableau worksheet. Very similarly to the previous one, you should click on the
data type icon that stands ahead of the field. Then, select a new data type
from the dropdown list that will appear.

In
the View itself
Another way how you can change the data type which is assigned to a field by default is from the View. Here, you should right click on the field itself. From the drop-down list, select Change Data Type. As a result, a list of data types will appear where you can choose your new data type.

Additional Notes Regarding the Mixed Data from Files in Tableau
When we import data from files like MS Excel, Access, CSV
or some other type of file, it is common for the columns to have mixed data
types. That means that data values with mixed data can have numbers and text
together. Or dates and numbers. When new data is uploaded, usually Tableau
detect the appropriate data type for the values and each column. And then,
assign that data type to the column itself. This is very simple when the values
in the column are only single data type. In this case, a date or text column
will be mapped as a dimension field. Or a numeric column, will be mapped as a
measure field.
But the tricky thing is when a column has more than one data
type in its value. Then, there are some mapping rules for each file type.
For Excel, the data type is decided due to the data type of
the first 10,000 rows.
When it comes to CSV file, the data type is decided based on
the data from the first 1024 rows.
Summary
In this article, we gained knowledge about different data types available in Tableau. We learnt that there are seven main data types in Tableau. String, Numeric, Boolean, Date, Date & time, Geographic and Mixed. Tableau is able to detect the data type of newly uploaded values and assign it to the relevant fields. Also, we learnt how we can change the data type on three different ways depending on the stage of the work process we are in.


